A student stares at a set of test scores and freezes. The teacher asked for the “range.” But wait: is that the highest score minus the lowest? Or is it that thing from the function graphs earlier this year? That confusion is exactly why so many students get this question wrong, even when they understand the math. If you’ve ever wondered what a range in math is, and why the word seems to mean two different things, this breakdown clears it up. We’ll cover the definition, how to calculate range, worked examples, where it fits alongside the mean and median, and where range fits in a function.
Key Takeaways
- A range in math has two meanings: in statistics it’s the gap between the highest and lowest values, and in functions it’s the full set of possible outputs.
- The statistical range is calculated with one simple step: maximum value minus minimum value, as in 42 – 4 = 38.
- Because the range depends only on the two extreme values, a single outlier can distort it and hide the data’s true spread.
- In functions like f(x) = x², the range is limited to non-negative numbers even though the domain includes every real number.
- The range describes how spread out data is, which is a different job from the median or mean that describe a data set’s center.

A focused online tutoring session makes math concepts easier to understand, one step at a time.
What is a range in math? (core definition)
The range in math is the difference between the lowest and highest values in a group of numbers. That’s it for the statistics version. Line up a set of numbers and look at the two ends. The distance between them is the range. It answers one question: how spread out is the data?
Here’s where students trip. The same word shows up in a second place. The range of a function means the full set of output values the function can produce. Same word, different job. We’ll separate those two later. For now, most classroom questions about “range” are asking about the statistical meaning.
So when someone hands you a data set and asks what a range in math is, you’re measuring spread. A small range means the numbers cluster tightly. A large range means they’re scattered. You see this in range in everyday life, like the gap between daily high and low temperatures.

Range Formula Explained: Step-by-step calculation using highest and lowest values in a data set.
How to calculate the range (step-by-step)
Calculating range is simple: subtract the smallest value from the largest. In symbols, Range = highest value − lowest value. One subtraction, one answer. It works because a range only measures the distance between the two ends of your data, so nothing in the middle changes the result.
Here’s the process:
- Look at your data set and find the highest value.
- Find the lowest value.
- Subtract the lowest value from the highest value.
Say your numbers are 15, 8, 22, 4, 19. The highest value is 22, and the lowest value is 4. So 22 − 4 = 18. The range is 18.
One tip to avoid mistakes: rewrite the numbers as an ordered list of numbers from least to greatest first. Sort 15, 8, 22, 4, 19 into 4, 8, 15, 19, 22, and the smallest and largest sit right at the ends. No hunting, no misreading. The U.S. Bureau of Labor Statistics uses spread measures like this in its data reporting, and its guide to understanding statistical measures like median and range shows how these tools apply to real-world figures. You can see how the BLS publishes wage and price data, where the gap between high and low figures matters. Calculating range is simple because it only uses two numbers: the extremes.
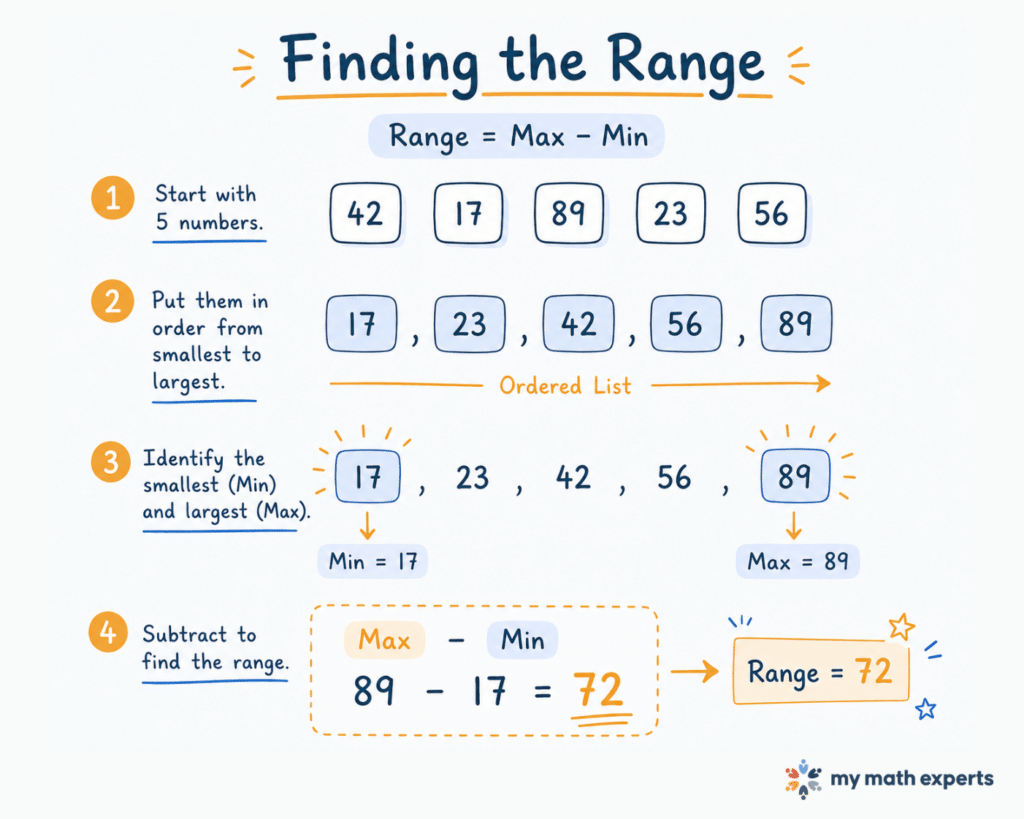
Learn how to find the range step by step: order the numbers, identify the minimum and maximum, then subtract. Range = Max − Min.
Worked examples finding the range in a data set
Let’s find the range in a few real data sets so the steps stick.
Solved example 1: A week of daily temperatures in Fahrenheit: 68, 72, 65, 80, 74, 69, 71. The highest value is 80; the lowest value is 65. So 80 − 65 = 15. The temperature range for that week is 15 degrees, a clear case of range in everyday life.
Solved example 2: Quiz scores: 88, 95, 72, 100, 84, 91. Order them: 72, 84, 88, 91, 95, 100. Subtract the smallest from the largest: 100 − 72 = 28. The range of these scores is 28 points. If your student wants extra practice with sets like this, our MME math worksheets offer plenty of problems to work through.
Solved example 3 (range with negative numbers): Overnight low temperatures: -5, 3, -2, 8, 0. The highest value is 8; the lowest value is -5. Here’s the part students miss: 8 − (-5) = 8 + 5 = 13. Subtracting a negative flips it to addition. The range is 13.
That third one is one of the most common mistakes in this whole topic. When you calculate range with negative numbers, always rewrite the double negative as addition. Skip that step, and you’ll report a range that’s too small every time.
Range within mean, median, and mode (measures overview)
Range doesn’t work alone. It sits alongside three other tools students meet together: mean, mode, median, range. Three of those describe the center of a data set. One describes the spread. Confusion starts when you mix up their jobs.
The mean is the average. The median is the middle value in an ordered list of numbers. The mode is the most frequent value. These three are called measures of central tendency because each points to the middle of the data in a different way. The range is different. It doesn’t describe the center at all. It describes how far apart the values stretch.
Many students assume range is just another average. In reality, it answers a separate question. Mean, median, and mode tell you *where* the data clusters. Range tells you *how wide* it spreads.
Why does this matter? Two classes can have the same average score of 80. But one has scores from 78 to 82, and the other from 50 to 100. Same center, completely different spread. You need both kinds of measures to see the full picture.
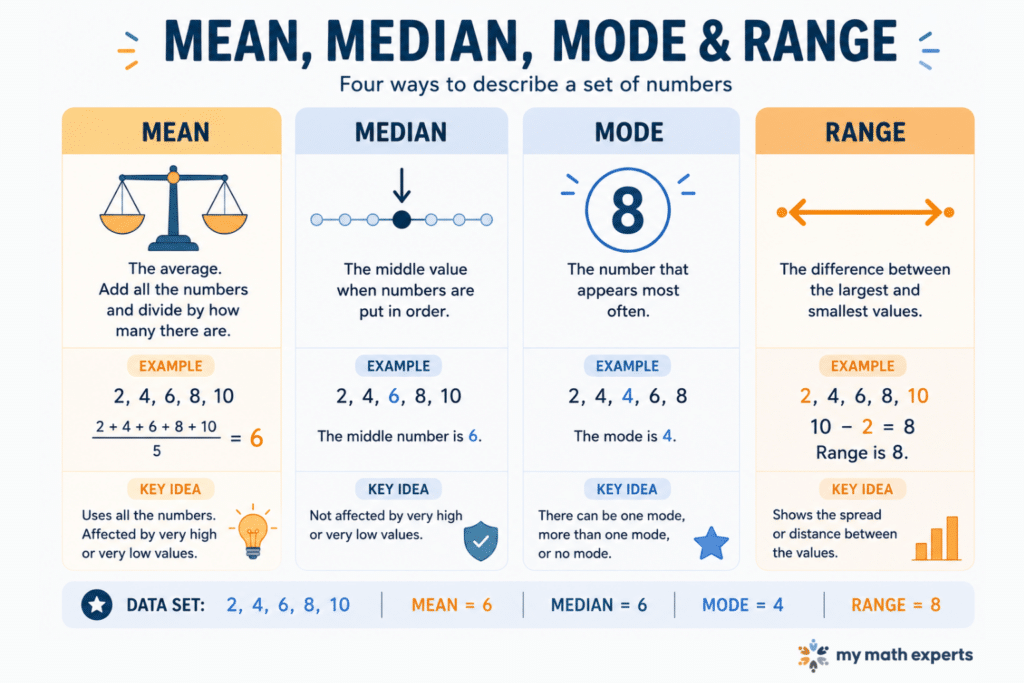
A quick visual guide to four essential ways to describe a data set: mean, median, mode, and range—with simple examples for each.
When students learn range in school (grade level)
Range usually shows up in middle school math, often around 6th grade, when students first work with data and statistics. That timing lines up with the Common Core State Standards, which introduce measures of center and variability in the 6th-grade statistics domain. These goals echo the NCTM data analysis standards, which shape how spread and center are taught. Range in statistics is one of the first spread concepts kids meet, because the arithmetic is friendly: one subtraction.
By middle school math, students are already comfortable with subtraction. So range becomes a natural entry point into thinking about how data behaves. This is a stage when middle school math tutors can reinforce the foundations before the concepts get harder. Later, in high school and beyond, the same students revisit spread with more advanced tools like interquartile range and standard deviation, which look at more than just the two extremes.
Picture a sixth grader who reverses the order and subtracts the largest from the smallest, or who reads -5 as bigger than -2. The range comes out wrong, and the mistake isn’t about range at all: it traces back to ordering numbers and handling negatives. The concept is easy. Students stumble on the underlying skills. That’s why solid foundations matter more than memorizing the range formula. A student who understands *why* we subtract the smallest from the largest will handle range with negative numbers, decimals, and larger data sets without panic.
Range of a function vs. range in statistics
Now for the part that confuses almost everyone. The word “range” means two different things depending on the topic.
In statistics, the range is a single number: the difference between the lowest and highest values in a data set. In functions, the range of a function is a *set*: all the output values the function can produce as you feed in different inputs.
Take f(x) = x². The input, or domain, can be any real number: negative, zero, or positive. But squaring any number gives zero or a positive result. So the range of that function is all non-negative numbers. Even though the inputs stretch to negative infinity, the output values never go below zero.
Many students assume both meanings are the same because they share a word. In reality, one is a measure of spread, and the other is a collection of possible outputs. The trick is knowing the context. If the problem hands you a list of data, you’re finding the statistical range. If it hands you an equation or a graph, you’re finding the range of a function.
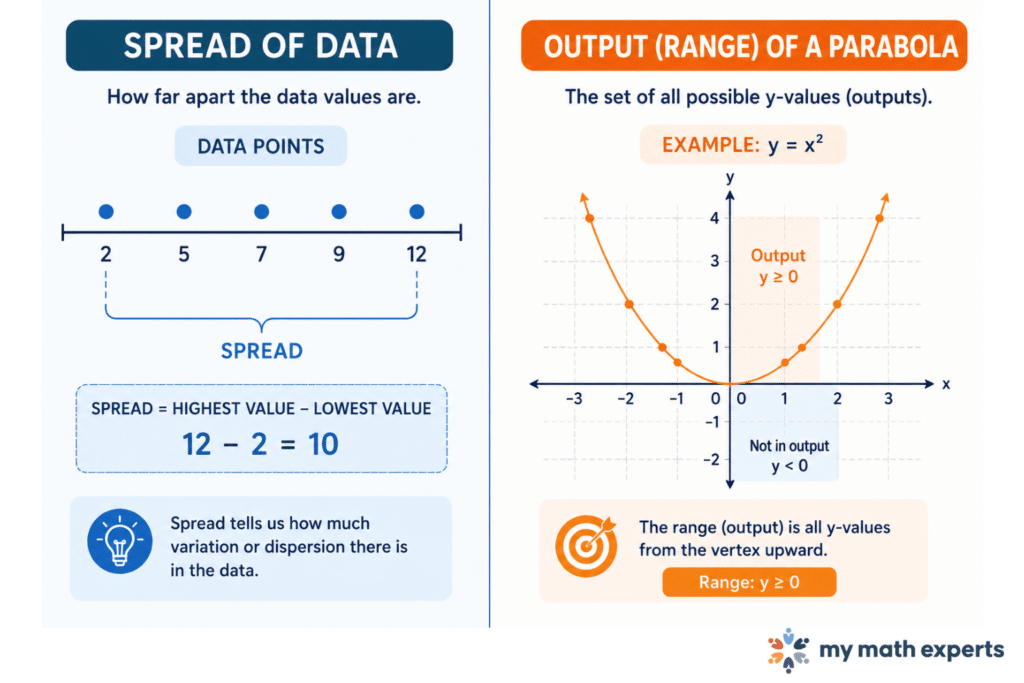
Range can describe different ideas in math, from the spread of data values to the possible outputs of a function.
Practice problems to try yourself
Grab a pencil and work through these practice problems. Answers follow so you can check yourself.
- Find the range: 34, 12, 47, 9, 28.
- Find the range of these scores: 55, 90, 73, 88, 61, 100.
- Range with negative numbers: -7, -3, 5, 2, -1, 9.
- A store tracks daily temperature highs: 41, 38, 52, 47, 35. What’s the temperature range?
- Function question: for f(x) = x² + 3, what is the range of output values?
Answers:
- 47 − 9 = 38
- 100 − 55 = 45
- 9 − (-7) = 9 + 7 = 16
- 52 − 35 = 17
- Since x² is always zero or positive, adding 3 makes the smallest possible output 3. The range is all values greater than or equal to 3.
If problem 3 tripped you up, that’s normal. Subtracting a negative is one of the most common mistakes with range. Rewrite it as addition every time. If problem 5 felt like a different kind of question, that’s because it is. It’s the range of a function, not a data set. Before diving into more practice, a math skills assessment can reveal exactly which underlying skills need attention.
How one-on-one tutoring helps students master range and data concepts
Range is simple on paper, yet students still lose points on it. The reason is almost never the subtraction. It’s the small foundational skills underneath: ordering numbers correctly, handling negatives, and knowing which meaning of “range” a problem is asking for. Those gaps are hard to spot from a graded worksheet alone.
That’s where consistent one-on-one support makes the difference. My Math Experts pairs each student 1:1 with the same tutor every week. The tutor learns exactly where that student stumbles and provides targeted, step-by-step instruction until the concept clicks. With personalized statistics tutoring, the work stays concept-first. That means not just the right answer on range, but understanding why it can mislead when outliers are present, and how it connects to mean, mode, median, and range as a group. Families exploring the benefits of working with a math tutor often find this consistency is what makes concepts finally stick.
Expert tutors also plan ahead. After the first few sessions, families receive a Personalized Success Plan that maps out the material and helps them plan next steps. Students who need targeted help can also get 1:1 online statistics support so a data unit today builds toward stronger footing in later topics. That patient one-on-one support aims for long-term understanding.
If your student keeps losing points on range, spread, or data problems and you’re not sure where the gap is, understanding range in math starts with pinpointing the missing skill underneath. My Math Experts offers 1:1 online tutoring to build real, lasting understanding. You can talk to an expert about your student’s math goals to explore your options and see if the program is a good fit. Results vary based on student participation, consistency, and academic needs.
Why Families Choose My Math Experts:
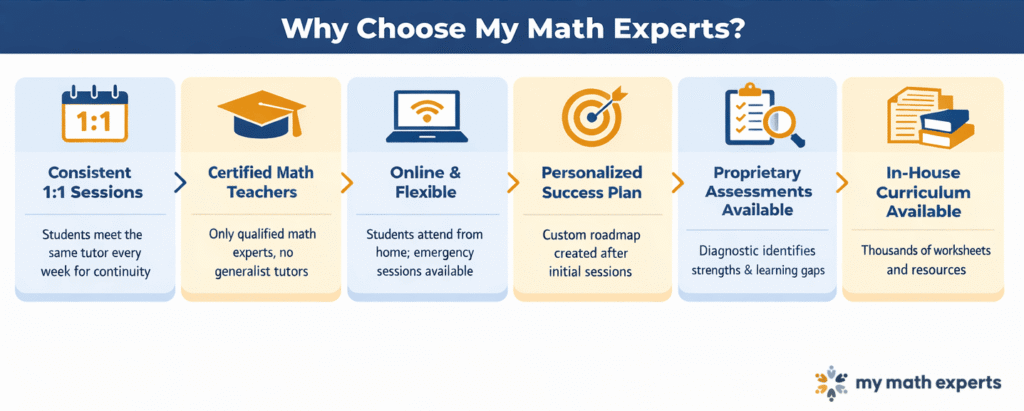
Key benefits of choosing My Math Experts, including personalized sessions, expert tutors, and flexible learning options.
- Always 1:1 with the Same Tutor: The same certified math expert works with students each week. Trust is built through consistency, and tutors can plan better for the long term since they know their students.
- Tutors Are Certified Math Teachers & Math Experts: Every tutor specializes in math. There are no peer tutors or generalists. Each tutor has thorough knowledge of math concepts, different skill levels, math jargon, and curriculum requirements.
- Consistent Weekly Sessions: Regular sessions allow students to maintain their progress and deepen their understanding, rather than cramming at the last minute for tests.
- Online and Flexible Sessions: They are held virtually, and students can attend from their homes. If a session is needed urgently, one can book it until the time it starts.
- Personalized Success Plan (PSP): Families get a detailed academic roadmap with resources, recommended textbooks, and goals after 2-3 sessions.
- Proprietary Assessment and Curriculum: Every student can be given a customized math skills assessment, which then leads to the generation of a learning plan that is tailored to their specific needs. Some students work on school work exclusively, others work on a blend of schoolwork and MME curriculum, and others only MME curriculum. We find the perfect blend based on your goals and make those recommendations during intake.
- More Than Homework Help: Tutors teach conceptually, track progress, and support true math mastery, not only provide quick help with assignments.
Students who can understand the range of numbers, the range of a function, as well as how data behaves, will be better prepared for higher-level mathematics, standardized tests, and long-term success.
Families interested in expert geometry tutoring can schedule a consultation with My Math Experts to discuss their child's goals, challenges, and learning needs. My Math Experts currently offers a 45-minute consultation for $15, 70% off the introductory rate, for those who wish to discuss the best tutoring method for their child, with flexible tutoring plans available to meet a variety of academic needs and goals.
Ready to Master Math with Confidence?
Don’t let challenges hold you back – our experts are here to guide you every step of the way. Book your personalized consultation today at My Math Experts and start turning confusion into clarity!
FAQs
Q1. What is a range in math?
In statistics, the range is the difference between the highest and lowest values in a data set, showing how spread out the numbers are. In functions, the range means the complete set of output values a function can produce.
Q2. What is the range of 1, 2, 3, 4, 5, 6, 7, 8, 9, 10?
The range is 9, found by subtracting the lowest value (1) from the highest value (10). So 10 – 1 = 9.
Q3. How do I find the range of a data set?
Identify the largest and smallest numbers, then subtract the smallest from the largest. For the set 12, 7, 24, 5, 19, the range is 24 – 5 = 19.
Q4. What is the difference between range and median?
The range measures spread by subtracting the smallest value from the largest, while the median is the middle value after ordering the data from least to greatest. The range describes variability, while the median describes the center of the data.
Q5. How is the range different from the domain in a function?
The domain is the set of all possible input values you can put into a function, while the range is the set of all output values it produces. For f(x) = x², the domain is all real numbers, but the range is only non-negative numbers, since squaring never gives a negative result.
Q6. Is the range a reliable measure of spread on its own?
Not always, because the range only looks at the two extreme values and ignores everything in between. A single outlier can inflate it, so it’s often paired with the interquartile range or standard deviation for a fuller picture.
Q7. What if my data set has repeated or negative numbers?
The steps stay the same: find the true maximum and minimum, then subtract. For example, with -4, 0, 3, 3, 8, the range is 8 – (-4) = 12, since subtracting a negative adds to the total.
Q8. Why do students confuse the two meanings of range?
The word “range” appears in both statistics and function work, but it means different things in each context. In statistics, it’s a single number for spread, while in functions it’s the full set of output values; knowing which context you’re in prevents mistakes.

Mr. Kemper is the founder and director of My Math Experts. He has taught and tutored thousands of math students in grades 1 - college over the last 20 years, in the classroom and in private education. Algebra is a special passion and Kemper believes that a solid Algebra foundation opens many doors. He has also trained and supported hundreds of teachers and continues to create and innovate in the math education world.