Every time you check the forecast before packing an umbrella, you’re reading a probability. The weather app that says “40% chance of rain” isn’t guessing wildly. It’s turning past patterns into a number you can act on. Examples of probability in real life hide inside choices you already make. Which route avoids traffic, whether a test result is reliable, how much your car insurance costs. This article walks through the most common ones, shows the math behind them, and gives you ways to spot probability wherever it hides.
Key Takeaways
- Real-life examples of probability include weather forecasts, insurance premiums, medical test accuracy, sports odds, and games of chance.
- A percentage like a 70% chance of rain reflects how often that outcome happened under similar past conditions, not a guarantee.
- Probabilities range from 0% for impossible events to 100% for certain ones, such as the sun rising in the east.
- People apply probability daily without calculating it, like deciding whether to bring an umbrella or avoid a traffic-heavy route.
- Learning probability supports stronger conceptual understanding, problem-solving skills, and confidence in statistics coursework and everyday decisions.

Everyday objects like dice, cards, coins, weather forecasts, and sports predictions show how probability shapes the world around us.
Quick intro: what probability means in plain terms
Probability measures the likelihood of an event on a scale from 0 to 1, or 0% to 100%. Zero means impossible. One hundred percent means certain, like the sun rising in the east tomorrow. Everything interesting happens between those two ends.
The basic probability formula is simple. Divide the number of favorable outcomes by the total number of possible outcomes. Flip a coin, and heads is one favorable outcome out of two, so the probability is 1/2, or 50%.
Real-world probability shifts from theory to data. Weather, medicine, and finance don’t count neat outcomes. They measure how often something happened in the past.
Weather forecasting and daily planning
Weather forecasting is the probability most people read daily without thinking twice. A probability forecast of “70% chance of rain” does not mean it will rain for 70% of the day. It means that under similar past conditions, rain fell about 70 times out of 100.
Here’s why this matters for weather planning. The number tells you how confident to be, not what will definitely happen. A 20% forecast still leaves room for a soaked afternoon. Many assume a 90% forecast guarantees rain. In reality, it just means rain is very likely, and a dry day within that 90% is unusual but possible. If you’re curious about the details, it’s worth understanding how the National Weather Service defines probability of precipitation.
Sports outcomes and game predictions
Sports predictions run on probability from the first whistle. Analysts don’t say a team “will” win. They assign a percentage, like a 65% chance, based on past performance, injuries, and matchups. Sports analysts and prediction models use probability to estimate the likelihood of different outcomes based on available data.
Take soccer as an example. If a team averages 1.8 goals per match, models use that rate to build a probability distribution over possible scorelines. A striker who converts 1 in 4 chances carries a 25% probability on each attempt.
Every sports prediction rests on the same probability formula. Favorable outcomes divided by total outcomes, refined by real data. That’s how a model turns “this team is good” into “this team wins 3 out of 4 times against opponents like this one.” It gives fans and analysts a shared language for uncertain events.

A sports analytics setup showing live match statistics, win probabilities, and performance data used to analyze a soccer game.
Insurance is probability sold as a product. Companies use risk assessment teams whose job is to estimate how likely you are to file a claim. A 19-year-old driver pays higher insurance premiums than a 45-year-old with a clean record. Younger drivers, as a group, tend to have a higher probability of an accident.
The mechanism is straightforward. Insurers pool thousands of similar customers, calculate the likelihood of an event across the group, and set premiums so the expected payouts stay covered. Your price reflects the average risk of people who look like you on paper: age, location, driving history, and health.
This is one of the clearest real-life applications of probability, because a wrong estimate costs real money. Underprice the risk, and the company loses. Overprice it, and customers leave. Insurance premiums vary by state because each state sets coverage rules and rating factors. What’s legal to price differs by state. Risk assessment, in short, is probability with a dollar sign attached.
Games of chance: dice, cards, and coin flips
Games of chance are where probability is easiest to see, because the outcomes are countable. Flipping a coin gives two equally likely results, so heads have a 50% probability. Rolling dice adds more possibilities. A single die has six faces, so rolling a four is 1 out of 6, roughly 16.7%.
A standard deck of cards makes it richer. Drawing an ace is 4 favorable outcomes out of 52 cards, about 7.7%. Rolling dice for a specific two-die total, like seven, means counting the six combinations that produce it out of 36, so 6/36 or about 16.7%.
Games of chance demonstrate how probability works over repeated trials. The outcomes may vary in the short term, but larger numbers of trials tend to reveal the underlying probabilities. Many assume a coin “owes” them tails after five heads. In reality, each flip is independent and stays at 50%. Games of chance are a favorite teaching tool because you can verify the probability yourself with a coin and a few minutes. For younger learners just starting out, our middle school math tutors often begin with these countable examples.
Medicine and health outcomes
Medicine leans on probability constantly, and getting it wrong has real consequences. When a doctor orders a test that’s “95% accurate,” a patient hears near-certainty. In reality, that 5% error rate matters a lot, especially when diagnosing rare conditions.
Here’s the counterintuitive part. Picture a screening test that’s 95% accurate for a disease that affects 1 in 1,000 people. Because the healthy group is so large, most positive results can actually be false alarms. That’s conditional probability at work. The chance you’re sick given a positive test depends on how common the disease is, not just the test’s accuracy.
Doctors use this reasoning to decide whether to order follow-up tests or start treatment. Medicine also uses probability to weigh treatment outcomes. A therapy that helps 80% of patients still fails 1 in 5. Understanding these numbers helps patients ask better questions and avoid panic over a single result. It’s one of the most consequential real-life applications of probability.
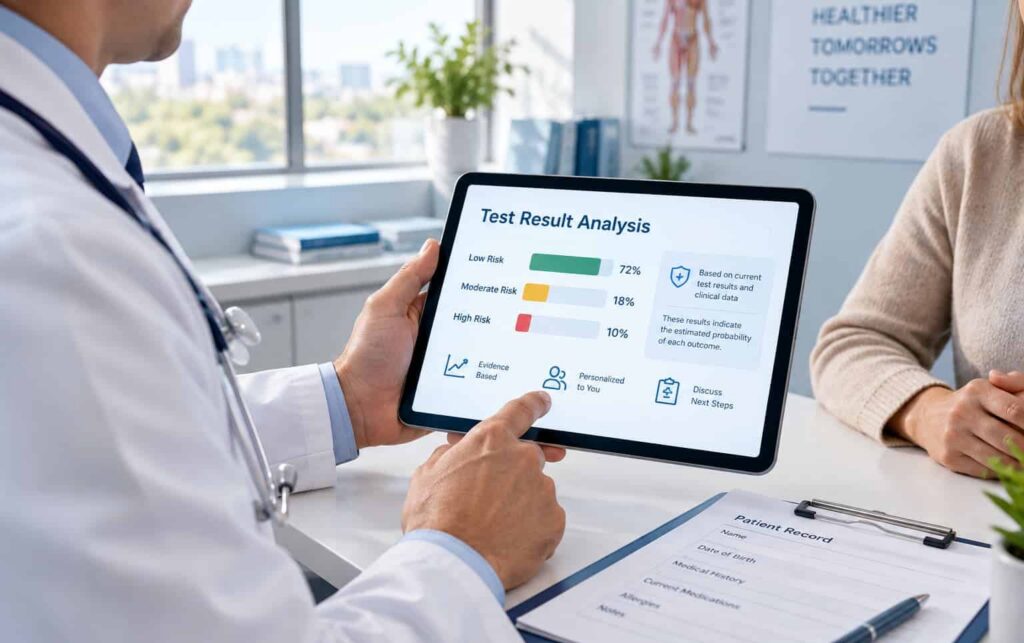
A doctor reviews test-result probabilities and patient information on a tablet during a clinical consultation.
Credit scores and financial decisions
A credit score is a probability estimate dressed up as a number. Lenders use predictive analytics to turn your payment history, debt, and account age into a single figure. It predicts one thing: how likely you are to repay a loan on time.
Credit scores exist because banks can’t know the future, so they estimate it. A person with a high score has historically behaved like people who repay reliably, so the model assigns them a low probability of default. That’s why higher scores unlock lower interest rates. The lender’s risk assessment says you’re a safer bet.
Every lending decision runs on this logic. Approve or deny, what rate to offer, how large a credit limit to grant- all of it comes from a probability model scoring millions of past borrowers. Credit scores show how probability shapes money choices in everyday life. Miss a few payments and the model updates your estimated risk, which changes the terms you’ll be offered next time.
Stock market and investment returns
The stock market is one long exercise in probability. No one knows tomorrow’s price, so investors estimate the likelihood of different stock market returns and weigh them against risk. A conservative bond and a volatile tech stock offer different probability distributions of possible outcomes.
Analysts study daily returns to build these distributions, plotting how often a stock gained or lost specific amounts. Many stock returns cluster loosely around an average in a probability distribution close to a normal curve, with big swings rarer than small ones. This lets investors estimate the probability of a loss beyond a certain size.
Portfolio decisions come down to expected value. Multiply each possible return by its probability and sum them up. A diversified portfolio spreads bets so one bad outcome doesn’t sink everything. The idea that markets are pure gambling misses the point. Disciplined investors use statistics and probability to manage risk, not eliminate it. Stock market returns can’t be predicted, but their range and likelihood can be estimated.
Everyday choices: traffic, lottery, and routine decisions
You run probability calculations all day without noticing. Choosing a route home, you weigh the chance of traffic on the highway against the slower-but-steadier side streets. That’s an informal probability forecast built from your own past commutes.
Lottery odds are the starkest example. A typical jackpot might have odds around 1 in 292 million, a probability so small it rounds to almost zero. People buy tickets anyway, since the tiny chance of a huge payoff can feel worth a few dollars. That’s probability meeting human psychology.
The pattern shows up in small everyday decisions too: whether to carry an umbrella, when to leave for the airport, which checkout line moves faster. Consider a driver who always takes the highway because it feels faster, ignoring that a fender-bender there costs 40 minutes while the side streets rarely lose more than five. Skipping the probability math quietly costs them time every week. It’s easy to overestimate rare, dramatic risks and underestimate common ones. Recognizing this sharpens your problem-solving skills and helps you make better everyday decisions. Once you see these as probability judgments, you notice how often you’re weighing certain or uncertain events without a single calculation.
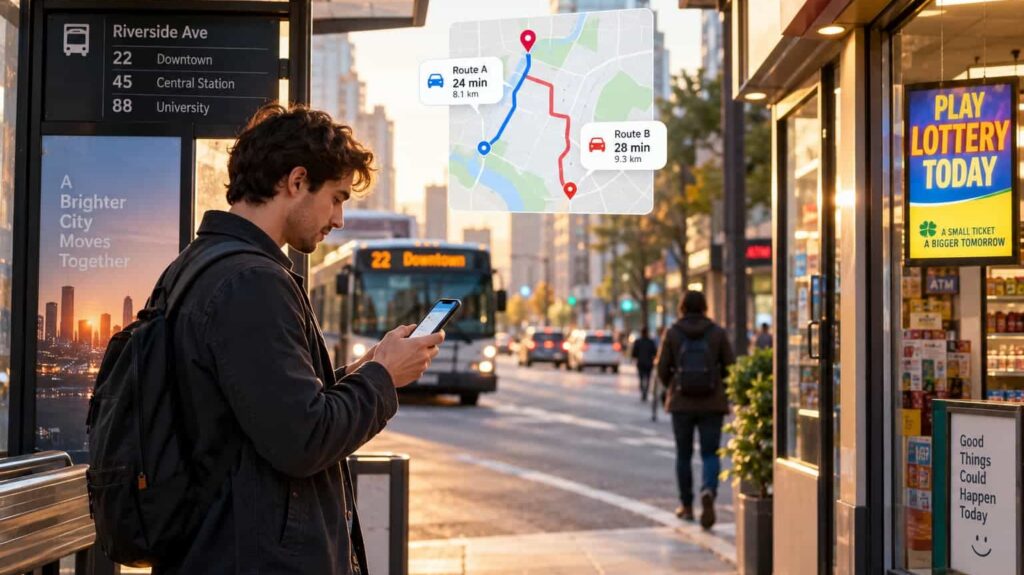
A commuter weighs route options while everyday choices and chance unfold around them.
Normal distribution examples (heights, test scores, birthweights)
The normal distribution is the famous bell curve, and it describes much of the world. Measure the heights of thousands of adults and most cluster near the average, with fewer people at the very short and very tall ends. Plot it, and you get that symmetric bell shape.
This pattern appears so often because many traits result from lots of small, independent factors adding up: genes, nutrition, environment. Birthweights follow it, as do measurement errors and, roughly, exam scores across a large group of students. The middle bulges. The extremes thin out. This same principle explains how large-scale surveys use sampling and probability to draw conclusions about entire populations.
This matters because a normal distribution lets you calculate probability precisely. About 68% of values fall within one standard deviation of the average, and roughly 95% within two. So if you know the average and spread, you can estimate the likelihood of any value. Recognizing a bell curve is a core skill in statistics and probability. It turns messy real-world data into predictable probabilities.
Why probability matters and how to build the skill
The importance of probability comes down to one thing. It’s how we handle uncertainty with logic instead of guesswork. Every example above, from weather forecasting to insurance premiums, uses the same core reasoning to turn incomplete information into a decision.
For students, this shows up directly in coursework. Probability is a full unit in high school statistics, and it underpins topics students meet in algebra and beyond. For students, personalized 1:1 online math tutoring can provide step-by-step support with probability and other challenging concepts. The goal is to build understanding and problem-solving skills, not simply memorize formulas.
Building this skill takes step-by-step instruction, not formula memorization. Start with countable examples like flipping a coin and rolling dice. Then move to probability trees for multi-step events, and finally to data-driven cases like a probability forecast. For students who want targeted support, personalized statistics tutoring can make these steps far less intimidating. The importance of probability grows as problems get less certain. Students who understand the reasoning, not just the answer, retain the material and can plan their next steps with confidence.
Simple probability activities to try at home with your student
You don’t need worksheets to teach probability. A few household objects and everyday decisions make the ideas click. Try these in order, from concrete to more abstract:
- Flip a coin 20 times and tally heads versus tails, then compare the results to the predicted 50/50 to see how real data wobbles around theory.
- Roll two dice repeatedly and record each total, then discuss why seven comes up more often than two or twelve.
- Pull cards from a deck of cards and calculate the probability of drawing a heart or an ace before each draw.
- Check the weather forecasting percentage together each morning and track whether the probability forecast matched the actual weather over a week.
- Draw a probability tree for a simple two-step event, like flipping a coin twice, and count the favorable outcomes.
The goal is understanding, not just getting the answer. Talk through why each result happened, and probability stops feeling like abstract math and starts feeling like a tool. If your student needs more structured guidance, one-on-one online statistics help can build on these activities with the same tutor each week. A quick math skills assessment can also pinpoint exactly where the gaps are before you begin.
If your student is struggling with statistics and probability, My Math Experts provides personalized 1:1 online math tutoring with the same tutor each week. Sessions focus on conceptual understanding, foundational skills, and steady academic progress. My Math Experts works with students across the U.S. through virtual sessions and helps remove the math friction from families’ lives.
Families interested in expert geometry tutoring can schedule a consultation with My Math Experts to discuss their child's goals, challenges, and learning needs. My Math Experts currently offers a 45-minute consultation for $15, 70% off the introductory rate, for those who wish to discuss the best tutoring method for their child, with flexible tutoring plans available to meet a variety of academic needs and goals.
Ready to Master Math with Confidence?
Don’t let challenges hold you back – our experts are here to guide you every step of the way. Book your personalized consultation today at My Math Experts and start turning confusion into clarity!
FAQs
Q1. What are some everyday examples of probability?
Common examples include weather forecasts (a 70% chance of rain means rain occurred in 70 out of 100 similar past conditions), insurance premiums, sports betting odds, and medical test accuracy. These situations all use probability to measure how likely an outcome is before it happens.
Q2. How do meteorologists use probability in weather forecasts?
When forecasters say there’s a 30% chance of rain, they mean that under similar atmospheric conditions, rain has historically occurred about 30% of the time. The National Weather Service bases this percentage on the forecaster’s confidence and the expected precipitation coverage across an area.
Q3. How is probability used in medicine and insurance?
Doctors use probability to interpret test results: for example, a test with 95% accuracy still carries a 5% chance of a false result, which guides further decisions. Insurance companies calculate the likelihood of events like accidents or health issues to set policy premiums and coverage.
Q4. What is an example of something with 100% probability?
A 100% probability describes an event that is certain to happen, such as the sun rising in the east or a newborn being younger than a teenager. On the same scale, an impossible event, like a number being greater than itself, has a probability of 0%.
Q5. Do I really use probability if I never do math?
Yes: most people use probability without noticing, such as grabbing an umbrella when rain looks likely or deciding whether to take a shortcut that might have traffic. You’re weighing chances of outcomes even when you never write down a single number.
Q6. How does probability shape decisions in games and sports?
In poker, players estimate the odds of drawing certain cards to decide whether to bet or fold, while bookmakers set sports odds based on each team’s chance of winning. A team with a 90% chance of winning pays out less than an underdog, because lower probability carries higher risk and reward.
Q7. Why does probability matter for real-world decisions?
Probability gives a structured way to handle uncertainty when you don’t have complete information, from investors weighing risk and return to families choosing an insurance plan. Assigning numbers to possible outcomes leads to more informed choices than guessing.

Mr. Kemper is the founder and director of My Math Experts. He has taught and tutored thousands of math students in grades 1 - college over the last 20 years, in the classroom and in private education. Algebra is a special passion and Kemper believes that a solid Algebra foundation opens many doors. He has also trained and supported hundreds of teachers and continues to create and innovate in the math education world.